In this article, I will discuss how to do day trade with five GAP trading strategies. Please read our previous article, in which we discussed the VWAP Trading Strategy in detail. You will understand the following pointers in detail at the end of this article.
- What is the GAP Trading Strategy?
- Why do Prices GAP up?
- GAP acts as Support and Resistance
- Types of Gap Trading Strategy
- What is the breakaway GAP?
- Why does the breakaway GAP occur?
- Runaway (or Measuring) GAP
- Exhaustion GAP
- Professional GAP Trading Strategies
- Gap Trading Strategies Summary
What is Gap Trading Strategy?
Gap trading is a strategy used in financial markets that involves capitalizing on the price gaps that occur between trading sessions or after the release of significant news or events. Price gaps are areas on a chart where the price of a stock (or another financial instrument) moves sharply up or down, with little or no trading in between. Traders focus on these gaps as they can indicate potential trading opportunities.
The difference between two consecutive candles’ closing and opening prices is called the gap. A gap occurs when prices skip between two trading periods, skipping over certain prices. A gap creates a void on a price chart. Price gaps are simply areas on the chart where no trading has occurred.

Why do Prices GAP up?
- Gaps Greatest imbalance between demand and supply. The gap is up because of the aggressiveness of buyers. I mean, there are more buy orders at the open than are available on the prior day’s closing price. The gap is down because of the aggressiveness of the sellers. There are more sell orders at the open than willing demand at the prior day’s close. Therefore, gaps are almost always at price levels with a supply and demand imbalance at the open.
- Gaps also occur due to the participant’s overnight sentiment or big news.
- Smart money is trying to avoid important support and resistance levels. If they are bullish, they will raise prices above the supply zone.
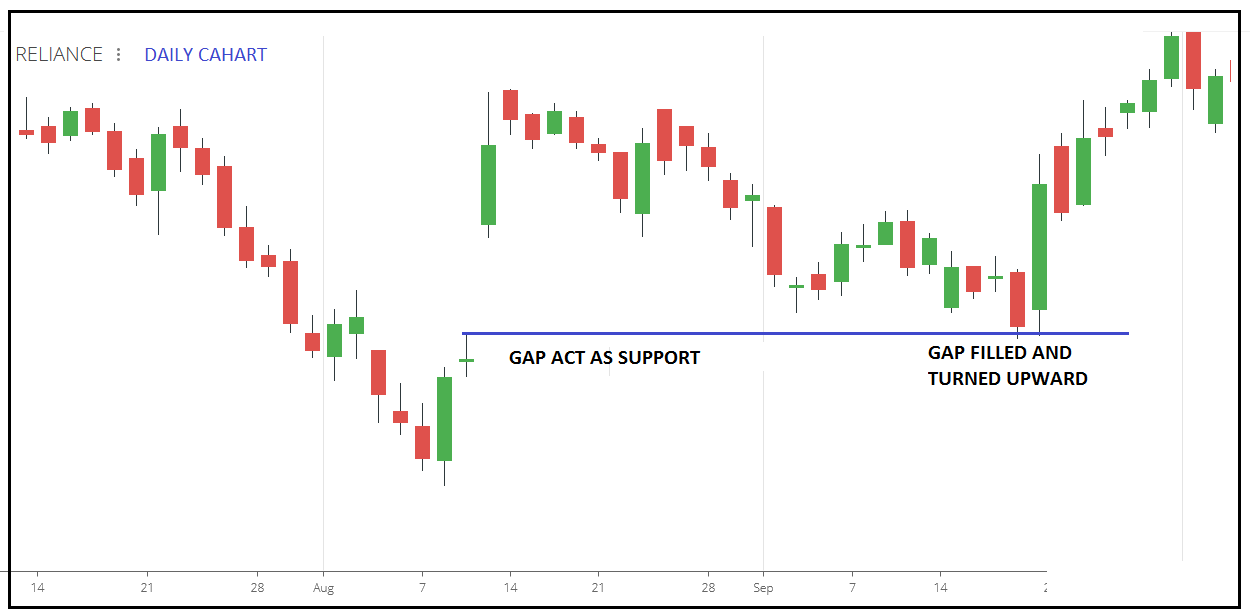
GAP acts as Support and Resistance
The Up gap acts as a support zone, and the down gap acts as a resistance zone. The chart below of RELIANCE stock shows the GAP up acting as support for prices.

The Gap fill
The gap-fill refers to the price retracing and closing the level where the origin of the gap occurs. The closure rate (gap-fill) for up gaps increases if the prior day’s open-to-close price trend increases. The closure rate (gap-fill) for down gaps increases if the prior day’s open-to-close move is downward.
After the GAP, the price tries to fill the gap. Another occurrence with gaps is that once holes are filled by price, the gap tends to reverse direction and continue in the direction of the gap (for example, in the chart BELOW of RELIANCE, back upwards).
Types of Gap Trading Strategy
Gaps are divided based on the context in which they appear.
- Breakaway (or Breakout) Gaps
- Runaway (or Measuring) Gaps
- Exhaustion Gaps
- Professional gap
- Inside gap
What is the breakaway GAP?
The breakaway gap means breaking the important support, resistance, or significant trend line. It generally appears after the completion of important patterns like price in the consolidation range or any continuation or reversal pattern. In maximum time, this gap does not fill quickly or on the same day. The most important volume should be high.

Why does the breakaway gap occur?
The smart money knows exactly where these resistance areas are. If the smart money is bullish and higher prices are anticipated, the smart money will certainly want a rally. The problem now is how to avoid the old resistance.
- Gapping up through an old supply area as quickly as possible is an old and trusted method – avoiding resistance.
We now have a clear sign of strength. Smart money does not want to have to buy the stock at high prices. They have already bought their main holding at lower levels.
Smart money knows that a breakout above an old trading resistance area will create a new wave of buying. How?
- Many traders who have shorted the market will now be forced to cover their poor positions by buying.
- Many traders are looking for breakouts to buy.
- All those traders who are not in the market may feel they are missing out and will be encouraged to start buying.
Here, you can see that prices have been quickly moved by smart money, whose opinion of the market is bullish. We know this because the volume has increased. It cannot be a trap-up move because the high volume supports it.


The chart study above shows breakaway gaps through important support and resistance levels. Every breakaway gap leads to a trend continuation.
Runaway (or Measuring) Gap:
After the move has been underway for a while, prices will GAP somewhere around the middle of the move. This gap is called the runaway gap. An uptrend is a sign of continuation of a trend; a downtrend is a sign of continuation of the trend.
 Gap Trading Strategy")
Exhaustion Gap:
You will find that weak gap-ups always gap up to resistance or gap down to support. This price action is usually designed to trap you into a potentially weak market and a poor trade, catching stop-losses on the short side and generally panicking traders to do the wrong thing.
The exhaustion gap occurs near the end of an uptrend. However, that upward gap quickly fades, and prices turn lower. When prices close under that last gap (exhaustion gap), it is usually a dead giveaway that the exhaustion gap has appeared. An exhaustion gap occurs with extremely high volume.

Professional GAP Trading Strategy:
These gaps appear at the beginning of the moves. Generally, it occurs in the supply or demand zone. (Gap up from demand zone and gap down from supply zone) when price approaches the quality supply and demand zone
. 
Inside GAP Trading Strategy
Inside gaps are gaps happening inside the prior day’s range.
- Week market gap up
- Strong market gap down
However, low volume warns you of a trap up-move (which is indicative of a lack of demand in the market) after a gap up resistance

Gap Trading Strategy:
There are three factors to monitor to determine whether the gap is real or trapped. The three factors are volume, opening price, and pullback
Opening Price and Pullback
After a gap up, the pullback to be watched
- Flat pullback (price consolidates high of the day). Strong buy signal
- The weak pullback was unable to close below the previous day’s high. buy signal
- Strong pullback closes below the previous day’s high. sell signal
If the stock gaps up and then sells off and remains beneath its opening price after the morning pullback has stabilized, the stock may have reached its high of the day. however, if a stock gaps up and pulls back during the morning pullback but then rallies to break above its opening price, the mark-up was probably not trapped GAP, and the stock should make new intraday highs
Volume
- It is important to watch the volume carefully when determining if a gap is valid. If the stock GAPs up high, the volume is also high, and the price remains above its opening price after the early morning pullback, it is an excellent sign that the stock has further to go on the upside. All reverse for a trap gap up
- If high volume appears after a gap up and the stock immediately comes under selling pressure, chances are that this volume was a seller.
- If a large volume of paper gapes up the situation and the stock runs higher, then chances are that it was a buyer, which is probably the reason for the gap up in the first place. The smart money will support the stock if he has the buyer, or he will sell stock quickly if he has the sellers. Smart money does not generally chase the stock in the direction of the gap in the early morning unless there is a fundamental reason for doing so
Our entry is based on two types of gap
- Outside gap(market open outside of the previous day range)
- Inside gap(market open inside of the previous day range)
Outside gap
1. Gap and GO Trading Strategy
All gaps are not filled in that day
Gap and GO Trading Strategy criteria
- The price GAP up above the previous day’s high
- Wait for the first candle to complete
- Volume should be high and supporting in the direction of the gap
- Mark opening range
- Entry on breakout of high of the day
- The price should be above VWAP.


2. Gap-fill reversal Trading Strategy
When a market gaps up, then the gap acts as a support level for any pullback. Pullback Tests of gaps on lighter volume tell that the issue does not have enough energy to get through the gap; instead, the gap becomes support, and our buy entry triggers any bullish signal
- Wait for the price gap to go up
- Please wait for a stock to pull back to its prior day’s close and fill the gap.
Two types of Pullback
- The price gap is up just above the previous day’s high or below the previous day’s low, and then a strong pin bar is formed, which fills the gap. volume should be high on the pin bar.
- The second price gap is up, and then it retraces and fills the gap. It takes more than two candles, and the volume should be decreasing.
- You then wait to see a sign of strength and enter the position on that move.
- Price should not close inside the previous day in any five-minute candle.
- You then place a stop below the low of the candlestick.


3. Open Gap Reversal Trading Strategy
These patterns generally appear at the top or bottom or in any strong supply or demand zone.
The open gap reversal process
- The chart needs an extended uptrend for at least a few trading sessions to the supply zone. A gap up in price to quality supply zone is a very high-odds shorting opportunity.
- Or, a GAP up in price to quality supply zone in a downtrend is a very high-odds shorting opportunity.
- After a GAP up, the price started falling and crosses yesterday. This generates the sell.
- The Stop-Loss is the low of the same day.
NOTE:-As we are trading against the gap, more confirmation is required confirmation, either from price action or volume action


4 & 5. Inside GAP Trading Strategy
Let’s analyze a downtrend, and the previous day was a down day. Today’s price gap is up but close to the previous day’s range. Our entry opportunity will be
- Gap up short
- Gap up long
In the context of a downtrend, a gap up in price is a very high-odds shorting opportunity if a bearish reversal signal is given. A gap up in price, in the context of a downtrend, is a lower-odds buying opportunity.
If the stock gaps up and then sells off and remains beneath its opening price after the morning pullback has stabilized, the stock may have reached its high of the day. however, if a stock gaps up and pulls back during the morning pullback but then rallies to break above its opening price, the mark-up was probably not trapped gap, and the stock should make new intraday highs
In an uptrend, entry opportunities will be
- Gap down long
- Gap down short
Gap up short in a downtrend
- Context downtrend
- Wait for at least 5 minutes. Or mark the opening range
- After the 5 minutes, wait for a reversal price signal to provide short-term confirmation that the markup was a trap by smart money and the short-term trend is pointing downward.
- The short below the first candle
- Volume should be below. If the stock has a GAP up high, the volume should be high to confirm the real gap. However, if the price closes below the opening price with no large volume, chances are that the mark-up was a trap by smart money.
Let’s analyze the gap down long in an uptrend


Gap up long in a downtrend
How to know whether the gap up is real or trapped by smart money
- When the gap opens, the volume should be heavy to go higher. if smart money is actively supported by volume
- Wait and see if the market trades above its opening prices after the morning pullback. It indicates the gap was real
- Then go along
- Or you can enter from a previous day’s low when the price retrace test of the previous day’s low.
Note: – This entry technique is very risky as we are going against the trend and momentum, so double confirmation is required


Combining our Pullback Trading Strategy and the Advance CANDLESTICK Analysis article is very useful for this trading strategy.

